

Data visualization
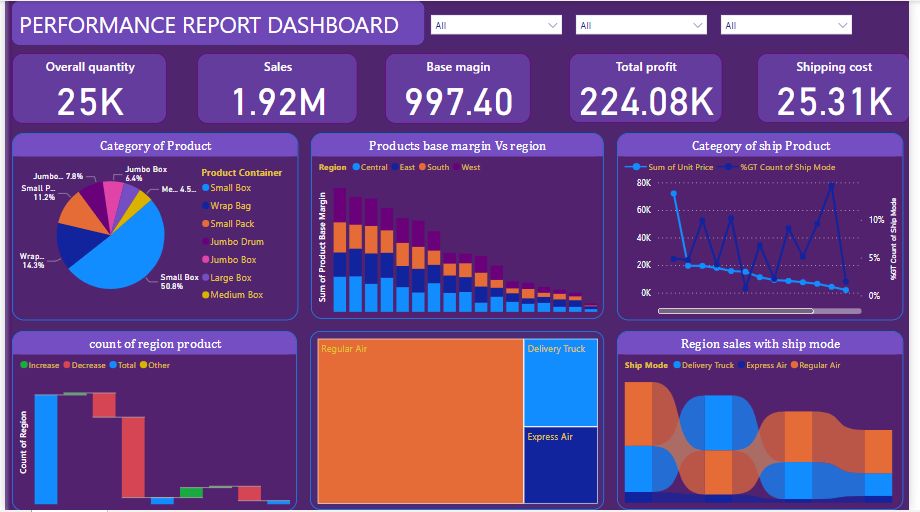
Unlocking Insights: A Guide to Data Visualization with Power BI.
Note this points in creating a dashboard….
1.Data Preparation
2.Creating Visualizations
3.Interactivity
4.DAX Formulas
5.Data Modeling
6.Storytelling
7.Publishing and Sharing
8.Mobile Optimization
9.Continuous Learning
There is no bounadries in learning.
Science and TechnologyYou may be interested in these jobs
-
3D Visualizer
1 month ago
Willstudio Lagos StateThis role involves conceptualizing and executing innovative design visualization rendering lighting effects and enhancing graphic presentation of projects. · ...
-
GIS Data Analyst
1 week ago
Polaris Digitech Limited Lagos+We are seeking a motivated and detail-oriented GIS Data Analyst with expertise in Geographic Information Systems (GIS) and Python programming. · +Collect clean analyze spatial non-spatial datasets from multiple sources. · Utilize GIS software e.g. ArcGIS QGIS to perform spatial ...
-
Data Entry Executive
1 day ago
Punch Group IkejaWe are looking to hire a Data Entry/Data Labeler to help us keep growing our team. · Come build with us. · Assist in collecting, cleaning, and analyzing data from various sources to identify trends, patterns, and insights. · Support the data team in creating and maintaining repor ...
Comments